Targets
Goals let you determine important environmental and CSR indicators and monitor whether these goals will be achieved. You can enter goals for environmental and other CSR themes. The goals dashboard lets you easily track progress and communicate it to others.
Add goals
When the Envirometer is first opened, the goals page will be empty since no goals have been selected yet. There are three sections where you can add (and change) goals:
- Graphs: You can enter a goal for each graph at the bottom of the page. These goals may be:
- A CO2 graph or environmental graph
- A total graph for all themes or a thematic graph
- A ‘regular’ graph or a normalized graph (per fte or m2, etc.)
- Key figures: For key figures, select a key figure and add a goal. The goal symbol shows which key figures have been added as a goal.
- CSR data: If you have entered CSR data (via finetuning and Manage CSR) these will automatically be the goals. The page about Themes and indicators contains more relevant information on the selection of Environmental and CSR-targets.
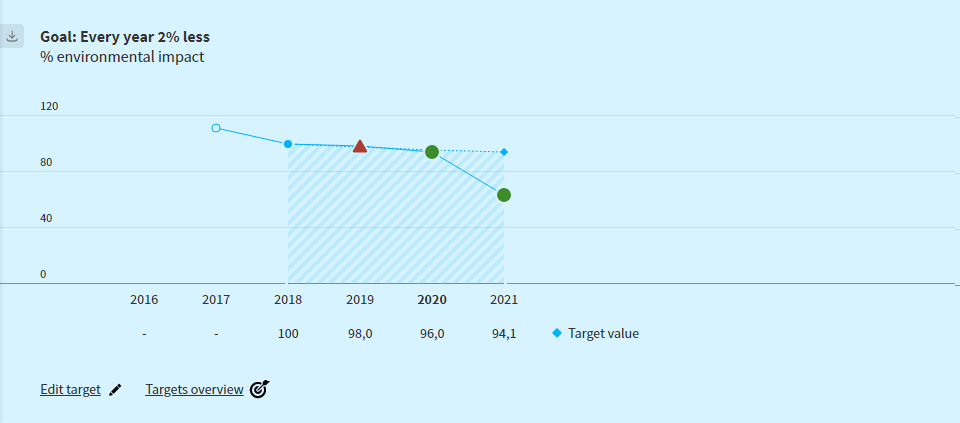
Tip: Use the download button at the top right of the goalgraph to download the graph. For more information check the Environmenter-help about graphs.
Tip:: If you don’t have five years of data yet, the Envirometer automatically increases the graph to five years in order to properly visualize the target line. When you have filled in five or more years, it will no longer do this. If you still want to see years in the future, create these years and leave them empty.

Adjust goals
When you create a new goal, you can adjust it immediately. If you want to adjust a goal from the Target dashboard, you can click on the goal icon in front of the name of the goal.
- Increase or decrease: Indicate what is better for that specific goal.
- Percentage or target value: Choose whether to base your goal on an annual improvement percentage or set a target value for each year. If you want the goal to be a fixed value (such as <2% absenteeism), enter the target value for the starting year.
- Show in report: Goals for internal analysis (i.e. not for a report) can be omitted from the report.
- Delete goal: Use the trash bin at the top right to delete the goal.
Important: If you already achieved your end goal at the start of your target period, the target line will not start at the first measured value, but will be a horizontal line in the amount of the end goal.

Target dashboard
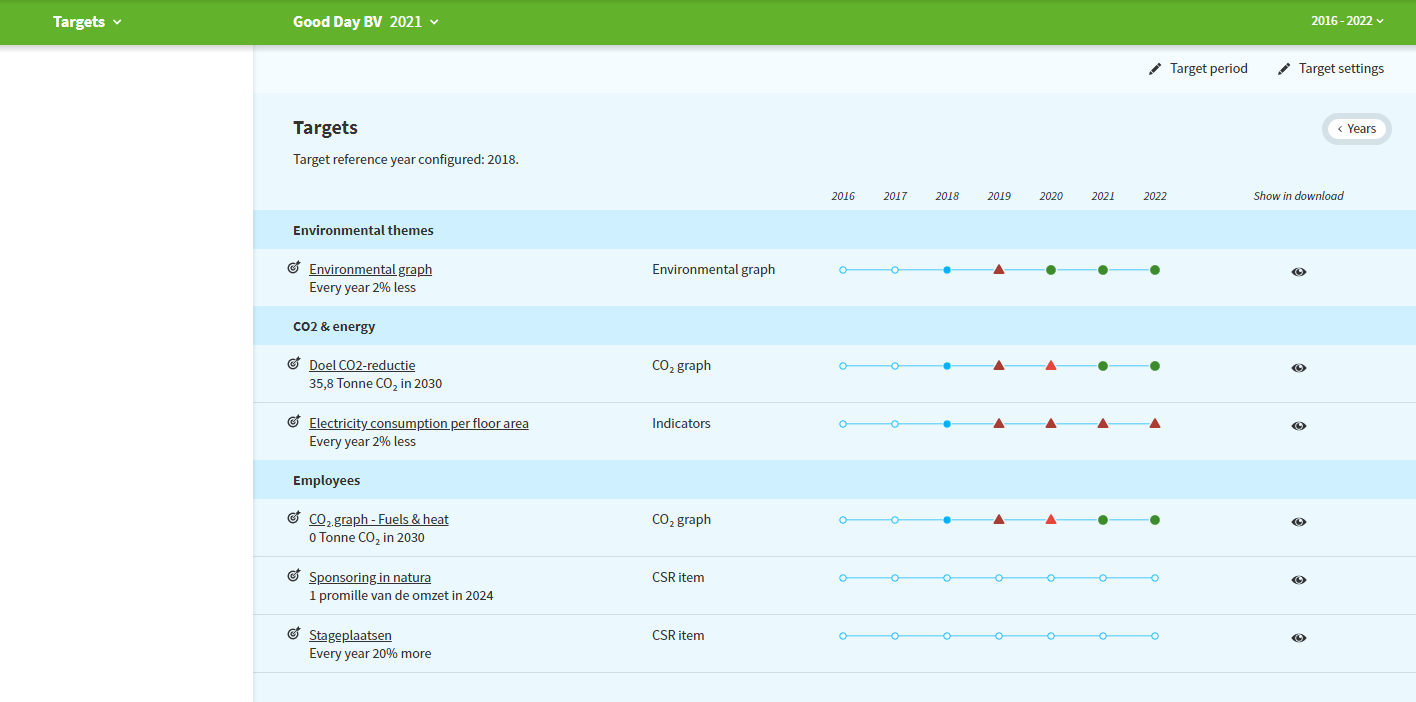
Use the green toolbar to navigate to Targets to display the target dashboard. You can also click Targets overview from the goal chart to return to the goals dashboard.
Here you’ll find an overview of all your goals together and from here you can navigate directly to the indocator (Graph, key-figure or CSR-Item) relevant to the goal. Here, you can adjust the goal if necessary.
At the target dashboard you’ll find the following functions:
- Time period: Choose for a representation of your goals in years or in another time period ((none, semi-annual, every four months, quarterly or monthly) with the year button in the upper right corner. This can be interesting if you have entered monthly values and want to follow the developments per time period. The type of time period (none, semi-annual, every four months, quarterly or monthly) can be changed via “period display” in manage Envirometers.
- Download: Use the PDF report function to download your target dashboard as a PDF.
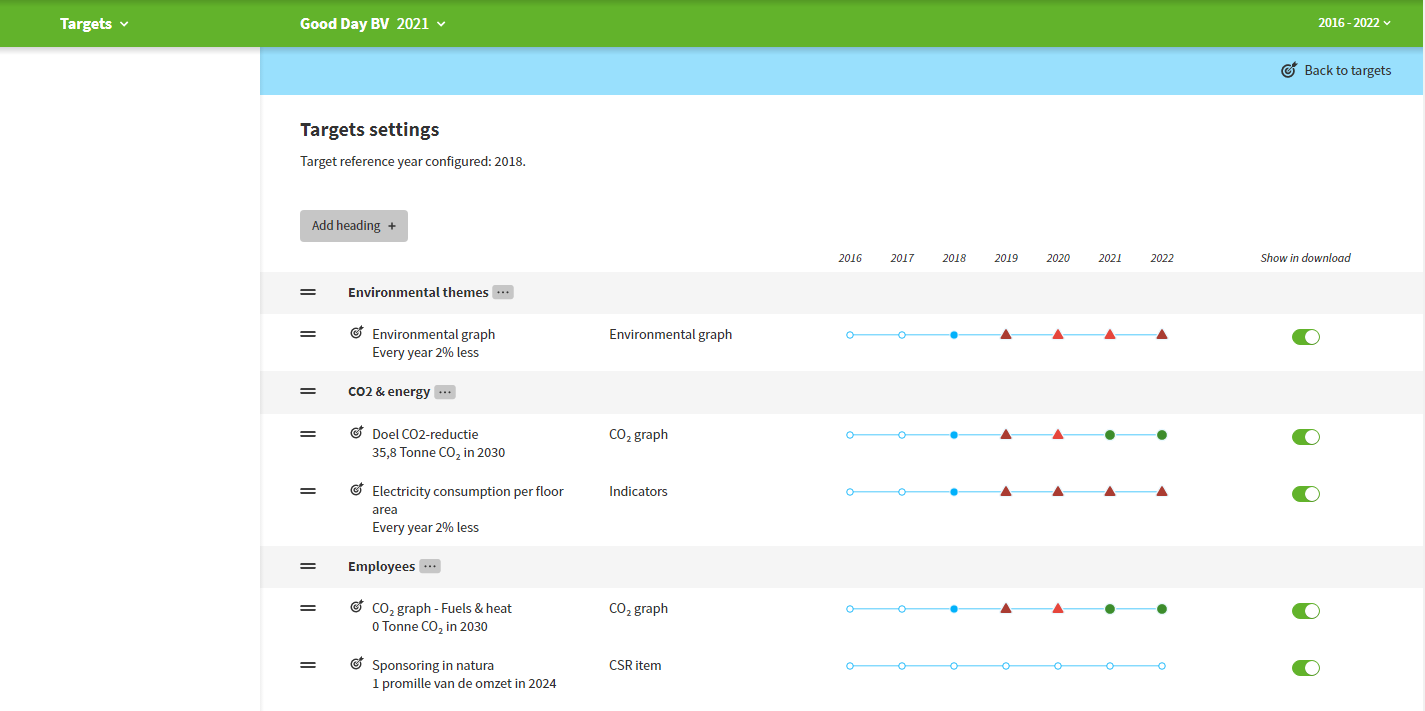
- Via Target settings (upper right corner) you can:
- Adjust the target dashboard : Classify and arrange your goals by means of themes and indicators
- Via Target period (upper rigjt corner) you can change the target period:
- Here you can set the reference year of your target period. If you do not set a target period, the oldest year in the picture is your reference year. The envirometer only calculates whether the goals are met for the years within the target period. For the years outside the target period, no green or red dots or triangles will be displayed.
- Changing the goal period is not the same as changing the time window. The goal period only affects your goal graphs and list of goals. The time window, on the other hand, determines which years are displayed.
- Clicking the target icon in front of a target name will navigate you directly to the target page.
Important: If you adjust your time window, the target graph will therefore usually change because you then shift your reference year.
