Envirometer for hotels
This page shows the environmental impact of the average hotel based on Envirometer graphs and key figures.
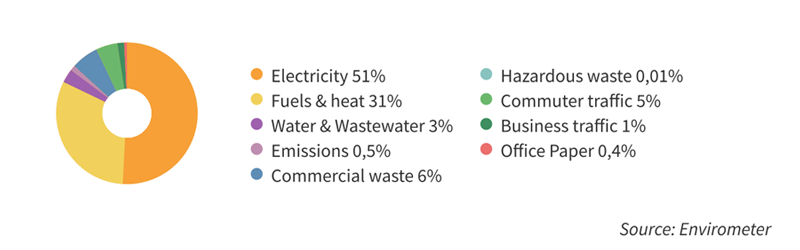
The pie chart shows the environmental impact distribution. Almost fifty percent of the environmental impact consists of electricity, followed by heating (fuels & heat) and commercial waste. Water and commuter traffic also play a significant part in the enviromental impact.
Key figures
The tables below show the most interesting key figures from the hotel benchmark. When you activate your own Envirometer you can compare your own key figures to the average key figures.
| Enviromental aspect | Key figure | Average | Range | Unit |
| Electricity | electricity / surface area | 71 | 60 – 180 | kWh/m2 |
| electricity / guest | 16 | 5 – 26 | kWh/guestnight | |
| heating energy consumption per building volume | 16 | 2,1 – 29.3 | m3 gas eq./m2 | |
| building-related energy / floor area | 1,2 | 0,9 – 2,2 | GJ/m2 | |
| building-related energy / guest | 0,22 | 0,07 – 0,44 | GJ/guestnight | |
| Water & waste | water consumption per guest | 220 | 23 – 294 | l/guestnight |
| waste per guest | 1,4 | 0,6 – 2,7 | kg/guestnight | |
| sorting of waste | 51 | 8 – 57 | % | |
| CO2-emission | CO2 emission per guest | 15 | kg CO2/ guestnight |
It’s notable that per floor area an inefficient hotel uses three times as much energy as an efficient hotel. Per guestnight an ineffecient hotel uses six times as much energy. For water usage they differ even by a factor of ten.
Source of this average Envirometer
This envirometer is based upon the energy- and water usage of over twenty hotels that participated in projects where Stimular assisted with filling in the envirometers. The waste and traffic numbers are based upon numbers of five hotels, and therefore less precise, but yet realistic.