Envirometer Housing Associations
This pages shows the environmental impact of an average office of a housing corporation, translated into graphs and efficiency indicators by the Envirometer. This concerns the housing corporation’s own operations: office buildings including any transport of a maintenance service.
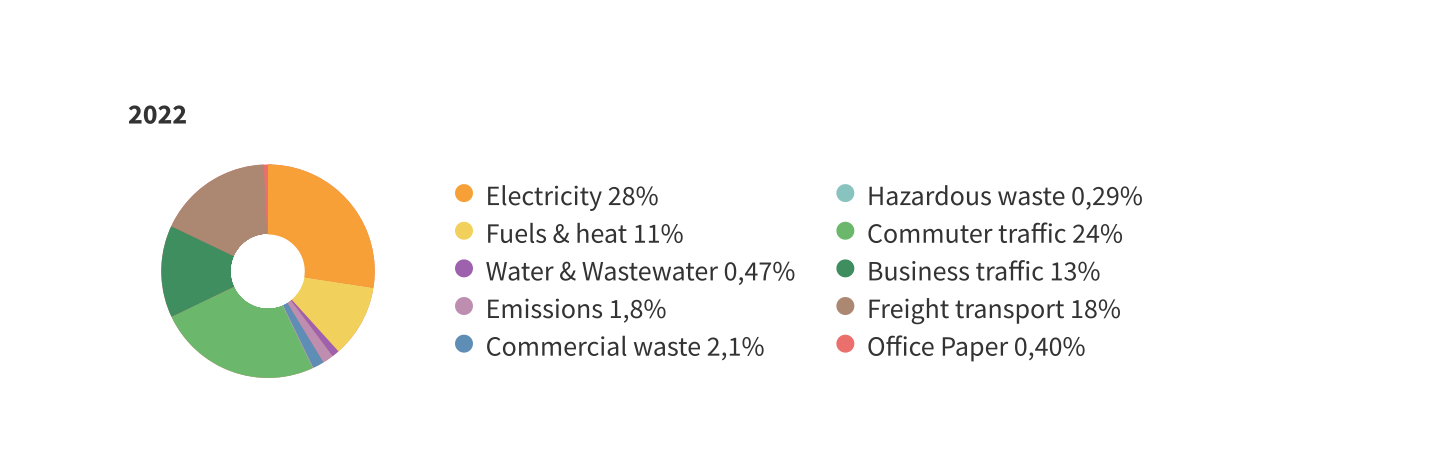
The pie chart shows the distribution of the environmental impact. The biggest environmental impact consists of electricity, commuter traffic and freight transport, followed by business traffic and heating. Waste, emissions water and office paper are included but have a smaller impact.
Key figures
The most interesting statistics from the Envirometer for an average housing association office can be found in the table below. After creating your own Envirometer, you can display the averages next to your own results for an easy comparison.
| Aspect | Indicator | Average | Best | Unit |
| Energy | electricity / floor space | 63 | 43 | kWh/m2 |
| natural gas / building content | 2.7 | 1.7 | m3 gas eq./m3* | |
| Water | water / employee | 3.3 | 0.9 | m3/fte |
| Waste | afval / employee | 84 | 34 | kg/fte |
| waste separation percentage | 52 | 69 | % | |
| Transport | commuting / employee | 2.719 | 741 | km/fte |
| Fuel business traffic / employee | 78 | 23 | lt. diesel eq/fte | |
| Paper | paper purchase / employee | 4.8 | 1.7 | kg/fte |
* With ‘fuel’ all energy flows for heating (natural gas, district heating, wood chips) are included, converted to natural gas equivalents.
Source of this average Envirometer
In 2023 Stichting Stimular carried out the Envirometer Benchmark for housing corporations for the fourth time. Fourteen housing corporations participated with a total of more than 30 office locations. Based on their data for 2022, Stimular has determined the average environmental score for offices of housing corporations.