Nursing homes
This page shows the environmental impact of the average nursing home based on Envirometer graphs and key figures. There are seperate benchmarks for mental health institutes and disabled care.
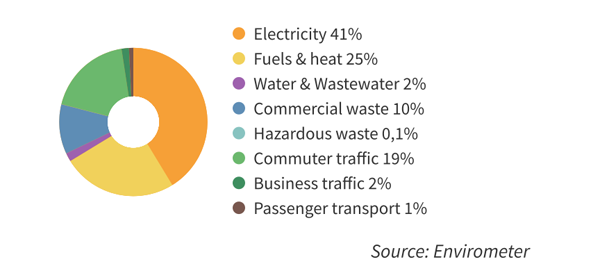
The pie chart shows the distribution of the environmental impact. Electricity has the highest environmental impact, followed by fuel (natural gas for heating). Commuter transport and waste alsof play an important part in the environmental impact. Business transport, hazardous waste and water & wastewater have a small impact.
Key figures
| Environmental aspect | Key figure | Average | Best | Unit |
| Energy | electricity / surface area | 64 | 29 | kWh/m2 |
| natural gas / surface area | 13 | 5 | m3 gas eq./m2 | |
| Building-specific energy / surface area | 1,0 | 0,7 | GJ/m2 | |
| Water | water / bed | 60 | 18 | liter/occupied bed |
| Waste | waste per bed | 807 | 320 | kg/occupied bed |
| waste separation percentage | 35 | 81 | % | |
| Traffic | commuter transport per employee | 4.458 | 959 | km/fte |
| business transport per employee | 373 | 91 | km/fte |
Source of this average Envirometer
In 2019, Stichting Stimular executed the “Envirometer Benchmark for Healthcare Institutions” for the third time (based on data from 2018). 17 health care institutions participated with a total of 50 barometers (about 80 locations, spreaded over 590.000m2). This formed the base for Stimular to determine the average environmental score for care institutions for the elderly (a mix of care and nursing homes).