Indoor sporting facilities
This page shows the environmental impact of the average gymnasium and sports hall
based on the Envirometer graph and key figures.
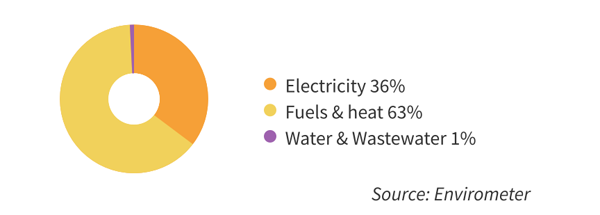
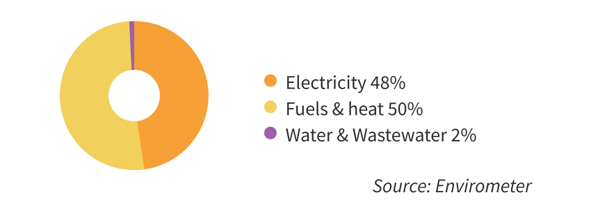
The graph shows the distribution of the environmental impact of electricity, heating and water. Waste and transport are not included. The largest environmental impact of an indoor sports facility consists of heating (usually natural gas), followed by electricity. Water is relatively insignificant.
A gymnasium is an accommodation with approximately 300 m2 of designated floor space for sports and doesn’t have a catering area. A sports hall has more than 900 m2 of floor space and usually has a catering area. A gym is somewhere in between and is closer to a sports hall than a gymnasium (it has a high usage time, has more showers and usually has a catering area).
Environmental chart gymnasium
Environmental chart sports hall
Key figures gymnasiums
Some interesting key figures from the Envirometer of an average gymnasium have been included below. Climatization hours are the number of hours that the property is kept at the right temperature, which on average is twice as high as the usage time.
| Environmental aspect | Key figure | Average | Range | Unit |
| Electricity | electricity / floor area | 25 | 10 – 44 | kWh/m2 |
| electricity / usage time | 7,3 | 3 – 16 | kWh/h | |
| electricity / usage time*floor area | 16 | 8 – 40 | Wh/m2h | |
| Fuels | heating energy consumption per building volume | 3,3 | 1,7 – 6,0 | m3 gas eq./m3 |
| heating energy consumption / heating hours | 1,6 | 1,1 – 2,1 | m3 gas eq./h | |
| Building-related energy | energy / floor area | 0,20 | GJ/m2 | |
| energy / usage time*floor area | 0,45 | MJ/m2h | ||
| Water | water / m2 | 160 | 54 – 300 | m3/m2 |
Key figures sports halls
| Environmental aspect | Key figure | Average | Range | Unit |
| Electricity | electricity / floor area | 32 | 22 – 55 | kWh/m2 |
| electricity / usage time | 32 | 19 – 59 | kWh/h | |
| electricity / usage time*floor area | 16,5 | 9 – 27 | Wh/m2h | |
| Fuels | Heating energy consumption per building volume | 2,2 | 1,3 – 3,6 | m3 gas eq./m3 |
| Heating energy consumption / heating hours | 10,3 | 3,4 – 26 | m3 gas eq./h | |
| Water | water / m2 | 195 | 117 – 270 | litre/m2 |
Saving opportunities
The energy and water use of gyms and sports halls/centres shows a large spread, even if we correct for floor surface and usage time. The factors that cause the greatest spread are:
- Insulation of the property (and age).
- If installations (light, heating, ventilation) are regulated on a occupancy base.
If you fill in your own Envirometer, you will be able compare your key figures to the average numbers. You can choose extra key figures and compare your locations. Both graph and key figures allow you to make comparisons per m2, m3, usage time, heating hours.
The biggest saving can be gained by regulating the use of the installations (light, ventilation, heating, cooling) on occupancy base. This certainly applies to buildings with a low number of hours of use. For buildings with a large usage time energy-efficient technology such as LED lighting and heat recovery pays off quickly. On average in a sports hall energy saving measures earn back faster than in a gymnasium.
A municipality can learn a lot about savings by comparing its own locations per usage time and/or square meter. Sharing experiences and saving measures with other municipalities can be a next step to make energy-efficient sports facilities.
Source of this average Envirometer
These averages are based on 21 gymnasiums, 3 gyms and 15 sports halls (the last two merged under the category sports halls) from seven municipalities that participated in the benchmark indoor sports facilities. This benchmark has been carried out by Stimular on behalf of the Vereniging Sport- en Gemeenten.
The locations are a mix of old and new. Operating hours ranged from 10 to 60 hours a week (gymnasium) and 15 to 120 hours a week (sports hall).