Envirometer for printing companies
Many printing companies use the Envirometer due to the sustainability associations set up in collaboration with the KVGO, municipalities and the Stimular Foundation. Participants use the Envirometer to review their environmental impact on an annual basis and to make mutual comparisons.
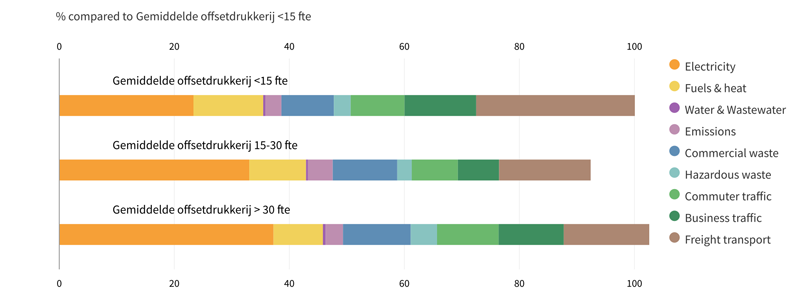
This page contains the average Envirometer and key figures for offset printers, rotary printers and finishing companies. The graphs show the importance of different environmental themes. Electricity, goods transport and commercial waste have the biggest environmental impact for most companies, expressed per kg of print.
Envirometer
The first graph compares three differently offset printing companies of different sizes (compared per kg of print work):
- small offset printers (<15 FTE)
- medium offset printers (15-30 FTE)
- large offset printers (>30 FTE)
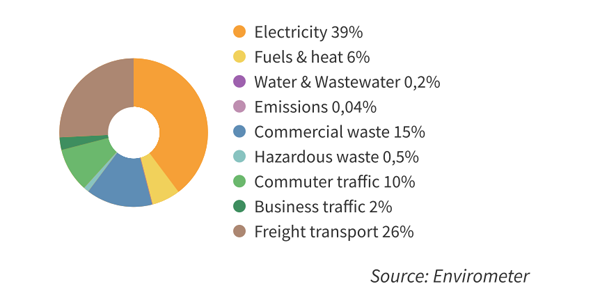
Rotary and label printers were also benchmarked per kilo of print work. The environmental impact distribution can be seen in the last pie chart. The most important difference with offset printers is that rotary printers use a printing technique with much higher volumes.

Finishing companies were benchmarked per employee because no suitable production volume could be found to compare the companies. Electricity and goods transport were the most important factors with these companies as well. Commercial waste was also surprisingly important.
Key figures
The tables below show several key figures from the printing benchmark. All key figures are annualized.
| Environmental aspect | Key figure | offset | rotary | finishing | unit | ||
| small | medium | large | |||||
| Electricity | electricity / surface area | 79.2 | 147 | 221 | 299 | 86 | kWh/m2 |
| electricity / kg print | 0.467 | 0.584 | 0.708 | 0.440 | N/A | kWh/kg | |
| Heating | heat / building contents | 2.03 | 2.31 | 2.27 | 2.57 | 0,97 | m3 gas/m3* |
| Water | water / employee | 11.5 | 14.2 | 24.4 | 22.4 | 7.81 | m3/FTE |
| Waste | waste / kg print | 0.216 | 0.165 | 0.385 | 0.272 | N/A | kg/kg |
| waste separation | 87.6 | 93.5 | 95.7 | 98.8 | 94.4 | % | |
| Transport | commuting / employee | 4.650 | 4.500 | 6.800 | 5.300 | 5.400 | km/FTE |
| percentage PT/biking/walking in commute | 24 | 19 | 18 | 24 | 34 | % | |
| business transport / kg print | 0.27 | 0.16 | 0.25 | 0.085 | N/A | km/FTE | |
| Raw materials | Ink loss | 34.8 | 18.4 | 15.2 | 5.74 | N/A | % |
| Paper loss | 18 | 26 | 29 | 20 | N/A— | % | |
| IPA use/print work | 1.33 | 1.48 | 1.44 | 0.34 | N/A | ltr/tonnekg | |
| detergent use/ print work | 1.59 | 1.94 | 2.68 | 0.50 | N/A | ltr/tonnekg | |
Source of this Envirometer
Stimular assists several printing sustainability associations, within which eight to fourteen printing companies in a region teach each other how to improve their sustainable innovation. Companies monitor and benchmark their environmental impact on an annual basis with the help of the Envirometer. These regional benchmarks were compiled by Stimular in 2013 to demonstrate what has been achieved so far and the opportunities the industry can capitalise on in the future. This benchmark was financed by the Ministry of Infrastructure and the Environment and the paper and cardboard knowledge centre.
The companies included in this benchmark were divided into the following five groups:
| Type of company | Number in benchmark |
| Offset small (<15 employees) | 18 |
| Offset medium (15-30 employees) | 14 |
| Offset large (>30 employees) | 14 |
| Rotary and labels | 7 |
| Finishing | 6 |