Envirometer for small construction companies
This page shows the environmental impact of the average small construction company based on Envirometer graphs and key figures.
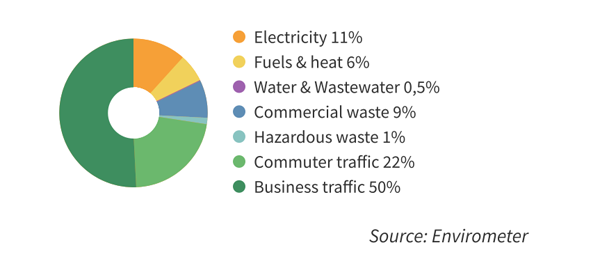
The pie chart on the environmental impact distribution shows that business travel, commuting and electricity have the highest environmental impact for a small construction company. Other significant factors include commercial waste, heating and hazardous waste.
Key figures
This average Envirometer also includes several indicative key figures.
| Environmental aspect | Key figure | Average | Unit |
| Electircity | electricity / floor area | 44,7 | kWh/m2 |
| Fuels | gas / volume* | 2,17 | m3 gaseq/m3 |
| Waste | waste separation (weight) | 34,8 | % |
| waste / turnover | 7,8 | kg/ 100 euro |
* All energy flows for heating (natural gas, city heat, wood chips) have been included under ‘fuels’ and converted into natural gas equivalents.
Source of average Envirometer
Stimular analysed the environmental performance of construction companies during the Fris Rijden en Bouwen project in collaboration with Bouwend Rijnmond, the regional industry association for construction companies. The environmental performance of the participating construction companies were quite similar. An average Envirometer and average key figures were calculated in 2009 based on the three participating small-scale construction companies, each with ten to twenty-five employees.
- The companies primarily carry out small projects and renovation activities.
- There are very few office employees compared to larger construction companies.
- Electricity and fuel are used for the office and the workshop.
- For some projects, construction and demolition activities are carried by the clients.
Large construction companies were not included in the average due to a larger variation in tasks, particularly in relation to those that are performed in house and those that are outsourced.