Envirometer for theatres and venues
This page shows the environmental impact of the average theatre/venue based on Envirometer graphs and key figures.
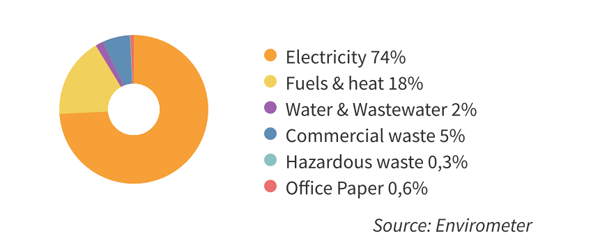
The pie chart below shows the environmental impact of the average theatre, distributed over various environmental themes. Electricity is extremely important, with ‘fuel & heat’ a secondary and waste a third theme. The average contains a relatively high number of theatres with city heating, which explains the low environmental impact for the theme of fuel and heat. Theatres heated with a natural gas boiler have a significantly higher environmental impact in this area.

Transport included
Some of the theatres also included data about their transport (commuter traffic, business traffic and goods transport). The graph below includes transport and illustrates that this significantly increases a theatre’s environmental impact. The graph shows that visitor transport accounts for more than twice as much environmental impact as the electricity consumption of the theatre.

Key figures
The table below includes several key figures from the theatre benchmark, as well as the average and the range. For the fuel theme, the use of city heating has been converted into natural gas equivalents.
| Environmental aspect | Key figure | Average | *Range | Unit |
| Electricity | electricity / surface area | 102 | 64 – 201 | kWh/m2 |
| Fuel | heat / building contents | 1.8 | 1 – 5.5 | m3 gas eq./m3** |
| Water | water / visitor | 17 | 7 – 38 | litres/visitor |
| Waste | waste / visitor | 240 | 60 – 600 | grams/visitor |
* Range = average +/- standard deviation
** All energy flows for heating (natural gas, city heat, wood chips) were included in the ‘fuel’ theme and converted into natural gas equivalents
Source of this average Envirometer
This average Envirometer was based on a theatre benchmark that includes twenty-seven theatres with data from 2015. They are members of the ‘Duurzaamheidskring Haagse Theaters’ and the ‘Overleg Amsterdam Theaters’. In which theatres and venues work towards reducing their environmental impact. Annualy they use the Envirometer to monitor their environmental results.
We did not include green energy in this average. Instead we pretended that the purchased electricity is 100% grey energy. In practice, theaters either use 100% green energy or 100% grey energy. A mix of green and grey energy in the graph would therefore not be representative of either group.
Averages for theaters have also been determined for 2011 and 2013. The group composition was not the same over the years and because of that we can only cautiously draw conclusions about the changes. The tendency is that first savings were made mainly on electricity and then on gas & heat. The savings on gas & heat are a combination of: more efficient heating boilers, the use of heat pumps (which reduce gas consumption and increase electricity consumption) and milder winters.