Swimming pools
This page shows the environmental impact of the average swimming pool based on the Envirometer graph and key figures.
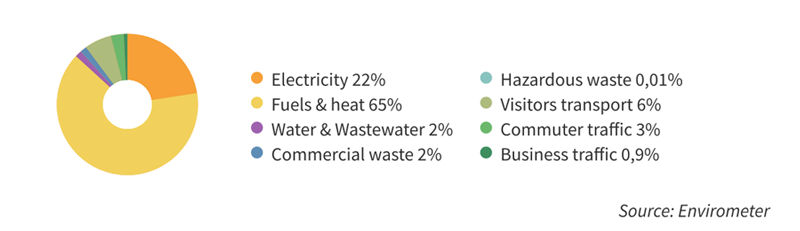
The pie chart shows how the environmental impact is distributed for the average swimming pool. The largest slice represents the highest environmental impact: use of fuel and heat. This is followed by electricity consumption and, at a considerable distance, water consumption and waste.
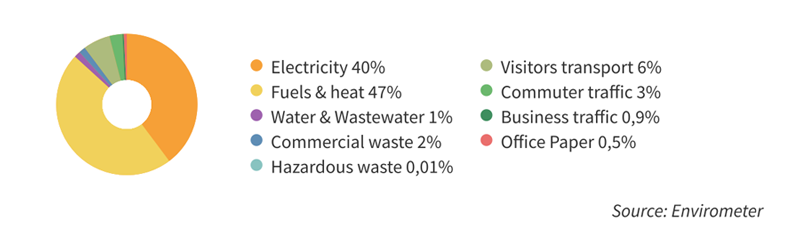
But in fact electricity is almost as important as heat. Many swimming pools have a CHP installation (combined heat and power). The CHP converts natural gas into electricity and heat for the swimming pool. If we were to leave this CHP value out of the average calculation, fuel would have almost half of the environmental impact:
Key figures
The most interesting key figures from the Envirometer for the average swimming pool have been included below. If you make your own Envirometer, you can compare the average values to your own key figures.
| Environmental impact | Key figure | Average | Range | Unit |
| Electricity | electricity / visitor | 3.5 | 2.3 – 5.3 | kWh/visitor |
| electricity / m2 pool | 780 | 300 – 1000 | kWh/m2 | |
| Fuel | Fuel / m3 water in system | 164 | 90 – 230 | m3 gas eq./m3 |
| fuel / visitor | 1.0 | 0.5 – 2.6 | m3 gas eq./visitor | |
| fuel / m2 pool | 230 | 130 – 340 | m3 gas eq./m2 | |
| Energy | building-related energy/m2 pool | 15 | 8 – 22 | GJ/m2 |
| Water | water / visitor | 80 | 50 – 120 | litres/visitor |
| suppletion water/visitor | 35 | 21 – 60 | % | |
| Waste | waste / visitor | 60 | 15 – 200 | grams/visitor |
| waste separation percentage | 32 | 10 – 50 | % | |
| CO2 | total CO2 emission / visitor (excl. transport) | 4.2 | 2 – 6 | km CO2 / visitor |
Source of this average Envirometer
Commissioned by the Vereniging Sport en Gemeenten Stimular calculated average Envirometers for swimming pools based on thirty-three swimming pools.
This benchmark contained a reasonably representative mix of swimming pools. In the instrument (logged on to the Envirometer) separate benchmarks are available for:
- Fourteen Indoor pools
- Eleven Combination pools
- Six Multifunctional sport-locations with a swimming pool.
- Two Outdoor pools (an indication).
Results for Indoor- Combi- Multifunctional and Outdoor Swimming Pools
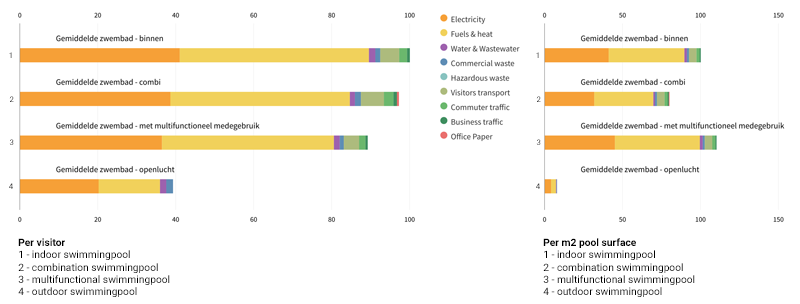
The environmental impact per visitor of the four types of pools do not differ that much. A multifunctional location scores on average 11% better than an indoor swimming pool. An outdoor swimmer seems to generate 17% less environmental impact than a indoor swimmer, but that is mainly because the outdoor pools had no insight into their amount of waste and transportation.
However, per m2 pool surface there is a clear difference:
- The multifunctional buildings have the highest environmental impact per m2 bath. That is understandable because there are additional functions in the building.
- The outdoor pools have a much lower environmental impact per m2 bath. That’s to be expected because they are open far fewer hours per year than the other baths. This result is interesting for other outdoor baths because a comparison with indoor pools is not interesting for them.
- The combination baths have the lowest environmental impact per m2 bath. This will be because the outdoor pools are not in use all year round. And possibly also because environment-friendly techniques such as solar thermal, cogeneration and waste heat from a factory are more easily implemented in combinationbaths because they are on average larger than indoor swimming pools whereby saving investments pay for themselves quickly.