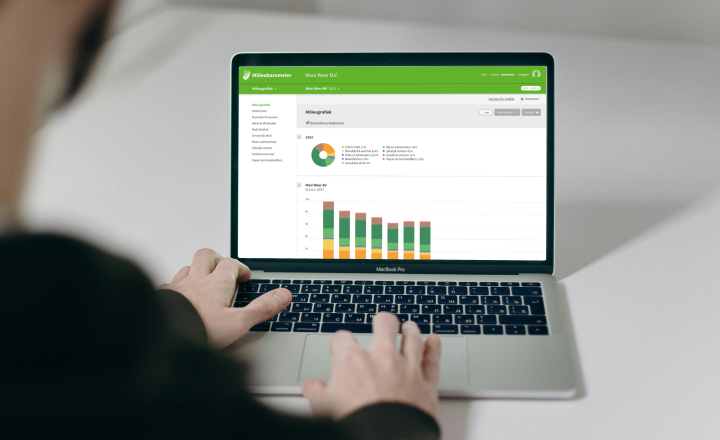
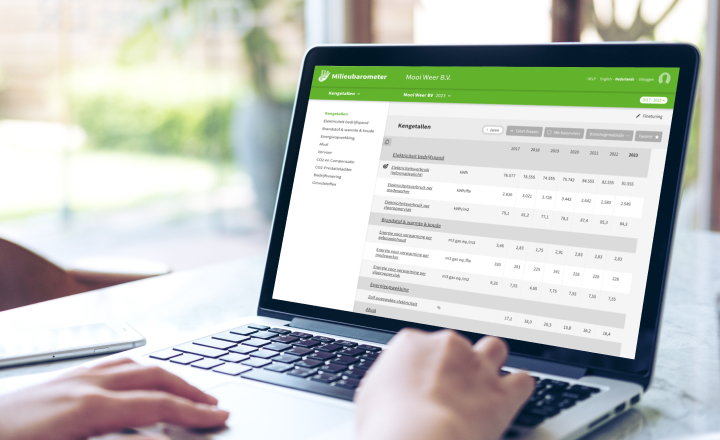
The right focus on sustainability through reliable insight
User-friendly online tool
Carbon footprint for businesses
Increasing sustainability

25 years of knowledge and experience
The latest emission factors

1800 businesses
Get started with the Envirometer
Want to get started immediately? No problem! Take out a subscription today and get started by filling in your details.

Milieubarometer implements new environmental prices of CE Delft
This year, the new environmental prices that CE Delft published in 2023 have been implemented in the Envirometer. This way we ensure that the tool remains up to date with developments in science and politics. But why is this important? And what exactly are the environmental prices?
Yearly update CO2-factors february 2024
The annual update of the CO2 emission factors took place on January 22, 2024 www.co2emissionsfactors.nl. All changes were implemented in the Envirometer on February 5. It is useful for Milieubarometer users to know the most important changes.

Current industry average for office organizations available in Envirometer
The Envirometer provides a new current industry average for housing associations and office organizations. This renewed industry average is based on data from 2022. As an office organization, you can use this new benchmark to compare the environmental impact of your organization.