Indicators
Indicators (i.e. efficiency indicators) convert absolute figures into indicators that are easier to analyse, such as electricity consumption per m2 or waste sorting percentage. Key figures are well suited for monitoring over the years. You can also compare them to other companies or other branches. They are a supplement to the Environmental graph and CO2 graph and enable other types of analyses.
Edit the display
- All Envirometers: Display the key figures of all Envirometers next to each other.
- Do you use copy years? If you select a copy year in the green bar, the inddicators table now shows all copy years.
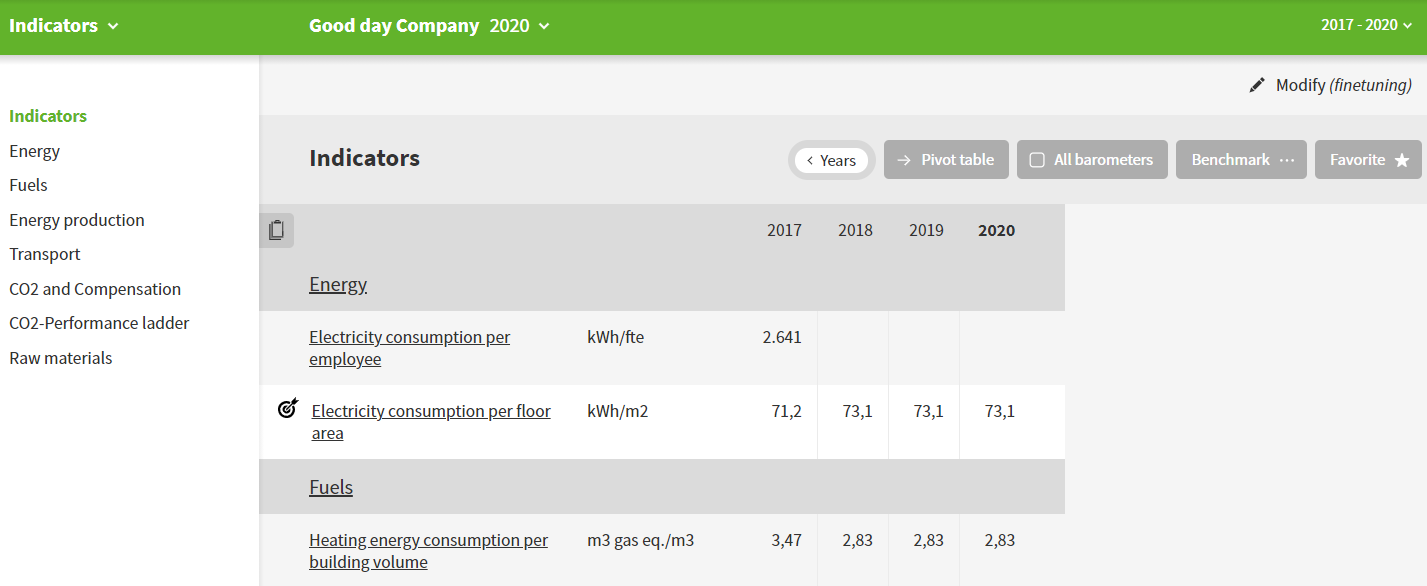
- Theme: On the left, select a category to view the key figures from that category only.
- Industry average: Display the benchmarks* to the right of your results.
- Rotate table: Choose a horizontal or vertical orientation of the table. This function is particularly useful if you want to display multiple years and Envirometers at the same time.
- Fine-tuning: You can customize the table with key figures via fine-tuning. The key figures are grouped in various categories. The fine-tuning of key figures follows the same process as fine-tuning in the data entry step.
- Years: You select which years are shown via the time window in the green toolbar. If you want to see 2016-2019, for example, you select this period and, if you only want to see 2020, you select 2020 twice.
- Year parts: To the right of the page title (”Key figures”) is a button that can be used to display the time period selected instead of the entire year. The key figures overview shows all time periods for all years in the time window. The view selector is set by default to semi-annual, but you can also choose to view by the four-month period, quarterly, monthly or remove this view option entirely via ”periodview” in manage Envirometers.
Tip: The copy button at the top left of the table lets you export the table and easily copy it into Excel/spreadsheet or a report.
Note: It might occur that you miss key figures in the benchmark column. That column only displays the key figures that are relevant to the industry. For instance: The elektricity per employee is unrelevant for Care organizations, because the electricity usage is not dependent on the amount of employees, but rather on the amount of clients or floor area.
Link goals to key figures
You can link targets to key figures.
- Click through to one key figure to add a goal.
- A key figure with goal can be recognized by the goal symbol in front of the key figure.
Tip: Are you viewing a key figure with a goal graph? Use the pivot table button to choose for the horizontal table lay-out.