Data Entry
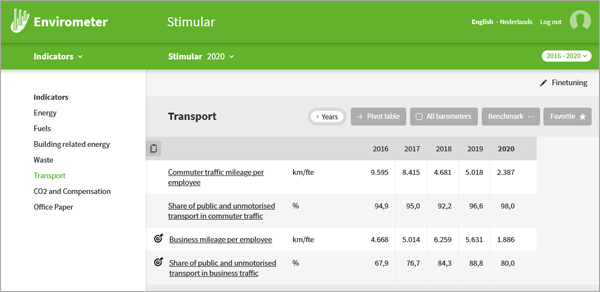
You enter consumption data such as electricity, fuels, water, waste and litres of diesel. This list of data is compiled at the start on the basis of your sector. You can always add and remove items yourself.

Thousands of companies use the Envirometer to determine their annual CO2 footprint and environmental score. The Envirometer is used as a baseline measurement, annual monitor and as the basis for environmental management systems and certificates.
The Envirometer has been completely updated in 2021! This guided tour shows what the instrument looks like and what the various options are.
You enter consumption data such as electricity, fuels, water, waste and litres of diesel. This list of data is compiled at the start on the basis of your sector. You can always add and remove items yourself.
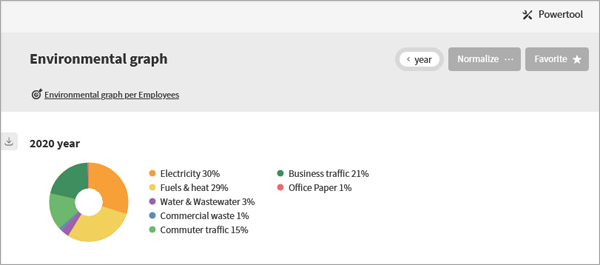
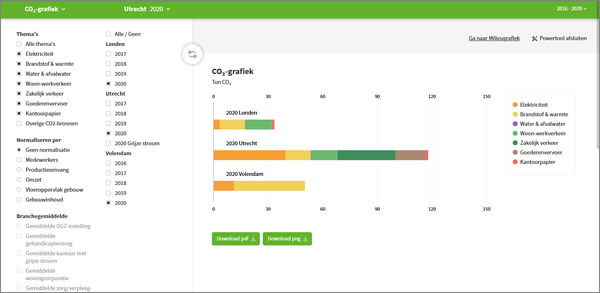
One of the most valuable features of Envirometer is the generation of graphs. The pie chart shows which business activities have the greatest environmental impact and where your priorities lie in terms of the environment. There is a similar CO2 graph that shows where you can save the most on CO2 emissions.
“The extra options when downloading graphs is an added value of the Envirometer”
Annie Dijkshoorn,
GGZ Delfland
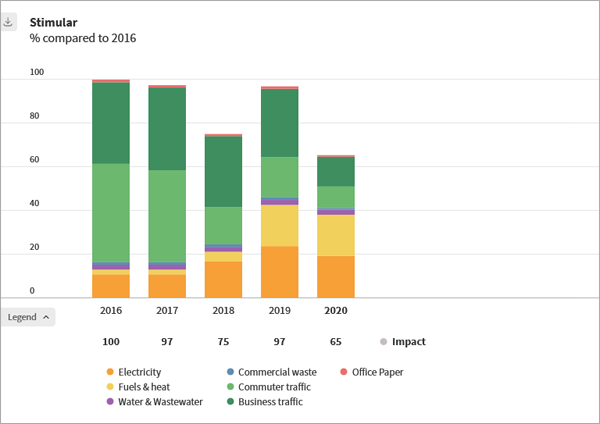
When you enter multiple years into the Envirometer you can see the effect of the measures you have taken. This allows you to communicate effectively about the results achieved with employees, customers and clients. Apart from recent years, you can also add previous years to show the ongoing trend.
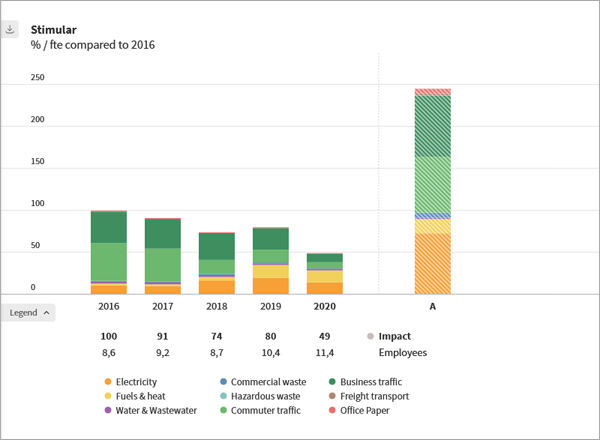
You can compare your company with an industry average thanks to the benchmarks. This allows you to assess how your company scores in comparison to the average and which elements provide the most benefit.
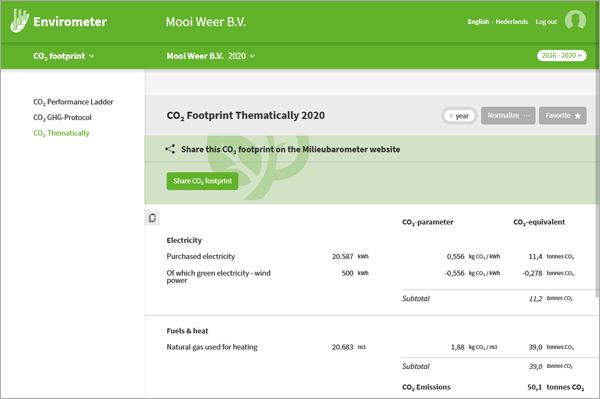
The Envirometer allows you to calculate and download your carbon footprint. This is useful to be able to provide for a tender or certificate.
You can choose whether to present your carbon footprint per element, according to the Green House Gas Protocol or the Dutch CO2 Performance Ladder.
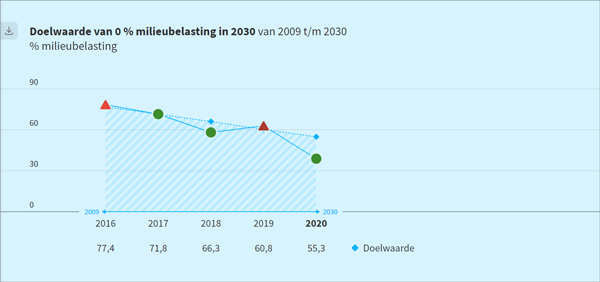
Key figures give an extra measure of control to manage improvement. A large number of indicators are available in the Envirometer. Think of the waste separation rate, electricity per square metre of floor space or number of solar panels needed to generate your energy. You select the key figures that you find relevant and you can add a target graph for every key figure.
Target graphs allow you to easily monitor your score relative to your goals, such as a 3% annual electricity savings or climate neutrality by 2050. After setting your goals, you can see your progress in the target graphs.
“One of the keystones of the Envirometer is to visualize everything. So what you can see you can actually do something about it. When you don’t see it, you can't do anything.”
Henrik Andersen, Energy manager,
Community of Aalborg, Denmark
The Envirometer allows you to keep track of which savings measures have been implemented and which ones you still have to implement.
You can add the year and a note to the measures so that it immediately becomes an action list.
The legally recognised measures in your sector can be identified by the dark blue government symbol. These are the measures you must report as part of the Dutch informatie plicht.

Large organisations can extend the subscription and thus compare graphs from multiple branches. This is useful for benchmarking.
Adding up all locations is automatic and included in the price.
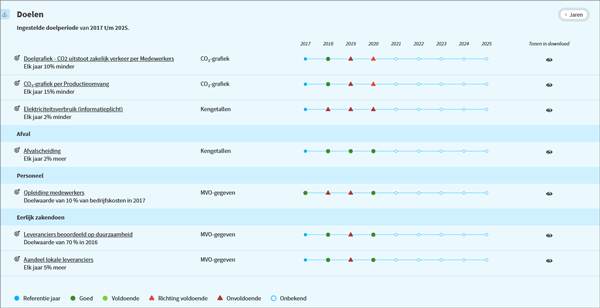
The target dashboard displays the scores of all the goals you set. You can see from the traffic light colours whether you are achieving your targets. You can customise the layout, order and text of your goals.
The PDF report generator allows you to create a Envirometer report in no time: clear and immediately usable to show to others. There are five formats and you choose which elements (graphs, tables, overviews) to include in the report. You can also export your data to Excel.

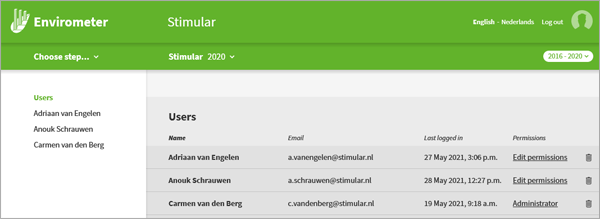
You can create unlimited new years or additional barometers for other branches via management. You can add additional users free of charge. You assign specific rights to each user, namely to read, fill in or manage.
The Envirometer has an online help which is also in English.
You can e-mail the helpdesk or phone: 010-2382828.
We also give Envirometer incompany training.

No, this instrument has many more built in elements than are shown in this guided tour. For example, you can
A subscription with several barometers also allows you to:
If you are unsure whether the Envirometer offers the functionality you need, please contact us: +31 (0)10 – 2382828